
"Tropical cyclones are one of the worst forms of natural disasters that can have a huge impact on the coastal regions. They are usually associated with a trail of destruction during landfall, resulting in loss of life and damages to property and infrastructure. With extreme wind speeds reaching as high as 120-150 km per hour, they pose a significant danger to humanity," says Prof Prasad K. Bhaskaran, Department of Ocean Engineering & Naval Architecture, IIT Kharagpur.
In the past two decades, India has witnessed many severe cyclonic storms that made landfall along the east and west coasts. The recent extremely severe cyclonic storm 'Tauktae' that made landfall in Gujarat (2021) resulted in huge waves engulfing low-lying areas, disruption in electric supply, and substantial economic losses. Broad-scale assessment of the population at risk suggests that an estimated 32 crore people, which accounts for almost one-fourth of the country's total population, are vulnerable to cyclone-related hazards.
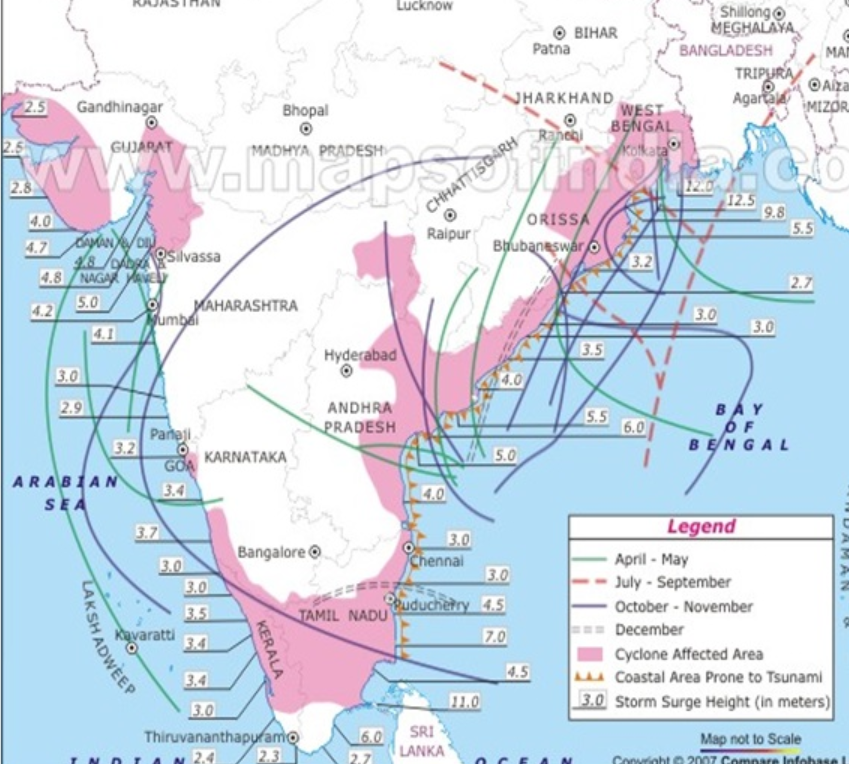
Moreover, the Indian subcontinent with a long coastline of 7516 km is exposed to nearly 7 percent of the world's tropical cyclones. On average, five to six tropical cyclones form every year, of which two or three could be severe. Therefore, a proper understanding of the formation of tropical cyclones (cyclogenesis) and their early detection have been amongst the key research fields for meteorologists worldwide.
A recent study by the researchers at the Indian Institute of Technology (IIT), Kharagpur, suggests that tropical cyclones can be detected prior to satellites over the warm ocean surface in the North Indian Ocean region. They have devised a novel method using the Eddy detection technique to investigate the formative stages of a tropical cyclone in the atmospheric column. The study has been conducted under the Climate Change Program with the support of the Department of Science and Technology, Government of India. The research team included Prof Prasad K. Bhaskaran and research scholars Jiya Albert and Bishnupriya Sahoo. The researchers have achieved a minimum lead detection time of 90 h (roughly four days) before the satellite detection. A larger time gap between the detection and landfall of tropical cyclones can be extremely crucial for proper evacuation efforts and disaster management.
To understand the working of this technology, we first need to understand the formation of a tropical cyclone and the remote sensing techniques currently used for its detection.
Formation of a Tropical Cyclone
A cyclone that occurs between Tropics of Cancer and Capricorn is known as Tropical Cyclone. It is an intense circular storm that originates over warm tropical oceans and is characterized by low atmospheric pressure, high winds, and heavy rain. It draws energy from the sea in the form of Ocean Thermal Energy and maintains its strength as long as it remains over the warm waters. A tropical cyclone is categorized into six different stages. Stage 6 is a Super cyclone stage, a cyclone so devastating that it has hit only once in Odisha (1999) in the past several decades.
A tropical cyclone is a coupled ocean-atmosphere phenomenon, and both play a vital role in its formation. There are mainly six favorable conditions that can develop a low-pressure system and further intensify it. Firstly, there should be a sufficient amount of ocean thermal energy, which is proportional to the ocean's temperature. Optimum temperature includes a minimum temperature of 26.5 degrees celsius up to a depth of 50-60m. Secondly, relative humidity must be enhanced in the mid-tropospheric (5-6km above the surface) region. The third factor is Conditional instability, a state when the instability of a column of air is dependent on its moisture content. Increased lower troposphere vorticity, which measures the tendency of a fluid to rotate at any point, is also essential. The fifth factor is weak vertical shear of horizontal winds, i.e., change in wind speed or direction with height (wind gradient). Finally, the sixth and most important factor is the Coriolis effect, a fictitious force experienced by objects in motion in a rotating frame of reference. Due to the Coriolis effect, tropical cyclones only form in regions at least 5 degrees north or south of the equator.
From the above, we can conclude that the basic ingredients to form a tropical cyclone are ocean heat and prevailing atmospheric conditions. If all the conditions mentioned above are conducive, it triggers the formation.

The formation of a tropical cyclone begins with the evaporation of large masses of warm seawater. As this warm air moves up and away from the ocean surface, it creates a void above the ocean surface, i.e., a low-pressure region. Cool wind from the high-pressure region rushes in to fill this void. Then this new "cool" air becomes warm and moist and rises, too. This rising warm air contains enormous amounts of moisture drawn from the ocean. As it rises, it cools and condenses to form huge clouds (about 10-15 km) in the troposphere.
Condensation releases the latent heat of energy stored in moisture and provides more power that creates a self-sustaining cycle. Moreover, as air is pulled into the low-pressure region, it starts to spiral around the center due to the Coriolis effect. At this stage, the cyclone matures, and the "Eye" of the storm is created.
The "Eye" is the central region of tropical cyclones with clear skies and warm temperatures. It is also the location of minimum atmospheric pressure (roughly 15% less than the pressure outside the cyclone). It can be 30-65 km in diameter and is the calmest region of the storm.
Satellite detection technique
Satellites can detect the depression or the low-pressure region over the ocean's surface. Various techniques such as the Dvorak technique are then used to analyze the intensity, wind speeds, and pressure based on cloud formation patterns. Finally, the tropical cyclone's movement and intensification are tracked, and predictions about its landfall are made using numerical weather prediction models (NWPMs).
However, the technique developed by the researchers from IIT Kharagpur takes a different approach. According to Prof Prasad Bhaskaran, "The true genesis of cyclone initiates in the atmospheric column before it develops as a low-pressure system over the warm ocean surface. Initiation and evolution of turbulent vortices in the atmospheric column further migrate along the vertical atmospheric strata and finally reach the warm ocean surface. It takes nearly five to seven days before the cyclone is detected as a low-pressure system on the ocean surface. So instead of studying the depression, we study the changes in the atmospheric column before the depression is formed, and thus we get a lead detection time."
Eddy Detection Technique
As mentioned above, Cyclogenesis( birth of a cyclone) begins in the atmosphere through the initiation and generation of turbulent eddies. In fluid dynamics, an eddy is the swirling motion of a fluid due to violent or turbulent flow.
For studying eddies, wind speed at different levels of the atmosphere starting from the sea surface up to a height of 10 kilometers is examined. The Genesis point, location in the atmosphere where these eddies form, grow, and interact with surrounding eddies, is then identified using that data. After the eddies amalgamate, they start to migrate (up and down) along the vertical column. Finally, when they become large enough in size, they can no longer move up along the column and thus reach the ocean surface as a depression.
In the atmosphere, eddies are always present in the form of chaotic movements due to wind and other factors. But all eddies cannot form cyclones, i.e., the detection of eddies alone does not mean that a cyclone will be developed. Therefore the research is centered around studying the "Spatio-temporal evolution of these eddies" and obtaining a threshold value. This examines if the eddies are strong enough to sustain themselves for long periods. This threshold value is determined in terms of the Okubo-Weiss parameter -
Okubo-Weiss Parameter
This parameter is a powerful tool for identifying the regions of high vorticity (high rotational tendency) in a flow field. It measures the relative importance of vorticity (rotation) to deformation in the flow field. The OW parameter's positive and negative values indicate that deformation and rotation, respectively, are dominant in the flow. In this technique, it is used to obtain a threshold value for differentiating between the developing and non-developing cases.
The research team also did a case study on four post-monsoon severe cyclones –Phailin (2013), Vardah (2016), Gaja (2018), Madi (2013), and two pre-monsoon cyclones Mora (2017) and Aila (2009) that developed over North Indian Ocean. These were selected due to their high intensity as each reached the stage of an extremely severe cyclone. The team found that the threshold values for pre-monsoon and post-monsoon cyclones are different. Moreover, for studying the evolution of these eddies with time, they used Hovmöller diagrams.
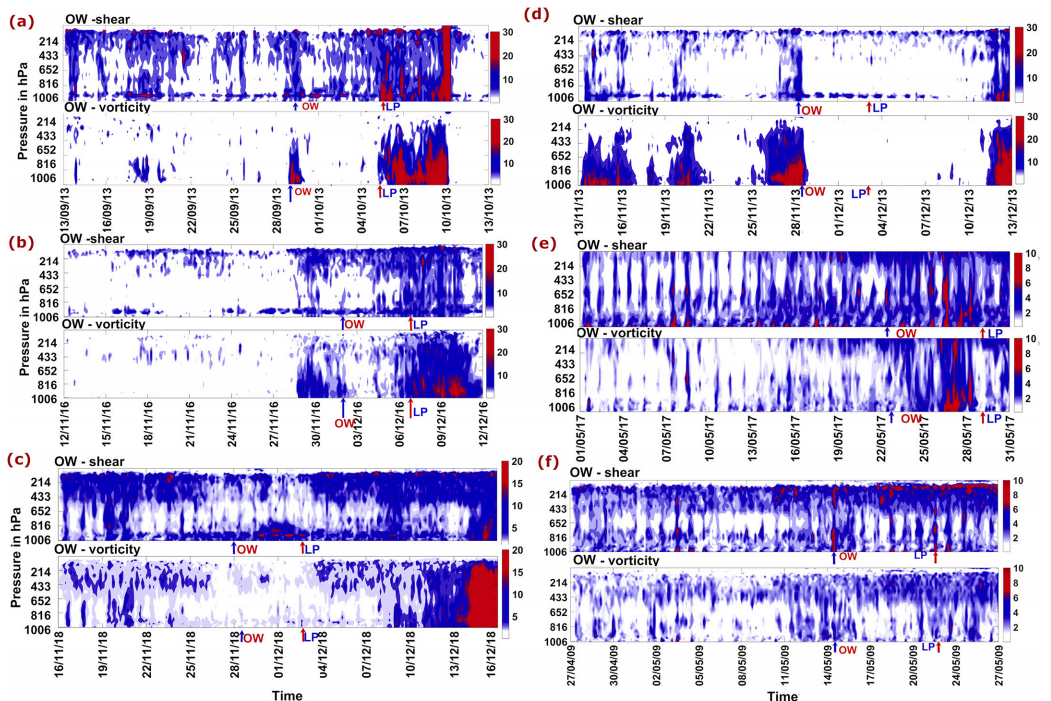
A Hovmöller diagram is a common way of plotting meteorological data to depict changes over time of scalar quantities such as temperature, density, etc. In this case, the vertical axis represents the pressure, and the horizontal axis represents the time(as dates). The OW mark in each diagram represents the stage when the threshold value for the eddies is crossed, and a tropical cyclone is detected. The LP mark shows the stage when the satellite detects a depression over the ocean surface. The OW mark is 4-5 days before the LP mark, representing the lead detection time for the particular cyclone.
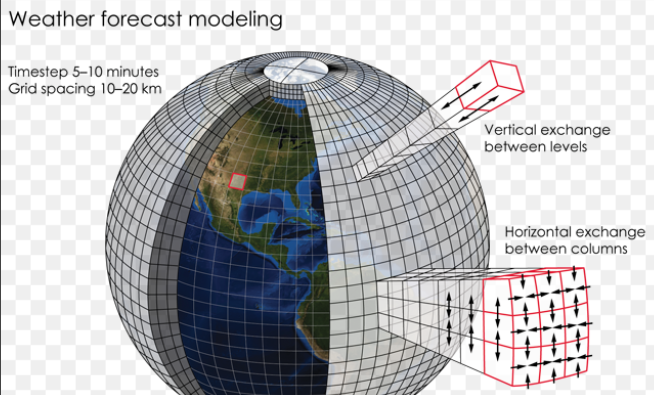
For simulating tropical cyclones, the team used the Weather Research and Forecasting model (WRF), which meteorological agencies are widely using for weather forecasting. They used a coarser grid resolution of 27 km for identification and a finer resolution of 9 km to evaluate the characteristics of eddies. Grid resolution represents the grid cell dimension (shown in figure) used for performing the model simulation.
The study was published in the journal Atmospheric Research, Elsevier.
Future Plans
The team has demonstrated that their study can be used for the early detection of tropical cyclones having wide practical applications in tropical cyclone forecasting. But one of the biggest challenges for them is to develop an automated system. They need to develop algorithms based on findings from this study and create an alert mechanism that warns the concerned agencies whenever eddies cross the threshold value.
The eddy detection technique is not a new technology; it has been developed long back and used in many fluid flow problems and laboratory-scale experiments. But the application of this technique in detecting tropical cyclones is the first of its kind. If the researchers can come up with robust algorithms to make this an automated device, this technology can be effectively put to use and save many lives.