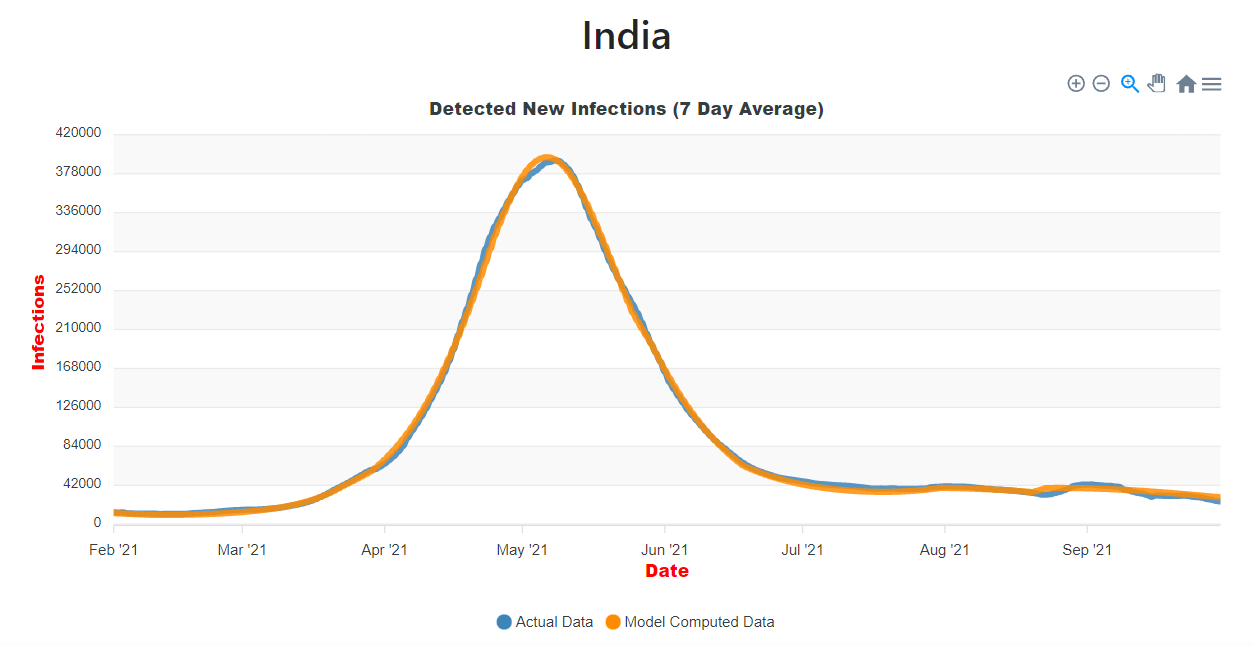
As the second wave of Covid hit our country, people were shocked and scared. No one had expected that the second wave of the pandemic would hit our country in such a manner. Here, the SUTRA model helped in predicting the spread of Covid-19 in each state of India.
Recently, the model came under a lot of criticism for its inability to predict the true magnitude of the second wave in early April. However, it was able to predict the peaks and active infections after mid-April due to which it has received a lot of credits.
What is the SUTRA model? Who developed it?
The SUTRA model is a mathematical model which stands for the Susceptible, Undetected, Tested (positive), and Removed Approach for charting the trajectory of Covid-19 in India. Professor Manindra Agrawal from IIT Kanpur, Madhuri Kanitkar(Deputy Chief, Integrated Defense Staff), and Professor M Vidyasagar from IIT Hyderabad developed this model last year to help predict the peaks of infections and active infections during the second wave.
How does this model work? How is it different from the other models developed for the past pandemics?
The model uses three main parameters to predict the course of the pandemic. The first is called 'beta', or contact rate, which measures how many people an infected person infects per day. It is related to the R-nought value, which is the number of people an infected person spreads the virus to throughout their infection. The second parameter is 'reach', which measures the exposure level of the population to the pandemic. The third parameter is 'epsilon', which is the ratio of detected and undetected cases.
Several features are different in this model. Previous models divided the population into Asymptomatic and Infected. Firstly, the new model takes into consideration that some fraction of asymptomatic patients could also be detected. Also, there would be a large number of undetected asymptomatic patients. Secondly, the model has explicitly taken into account the spatial spread of the pandemic over time through a parameter called 'reach'. Third, it uses numerically stable methods for estimating the values of all the parameters using the daily new infections data series. Where data on number of recovered patients is available, the model predicts the number of cases as a function of time. Where recovery data is not available, the model predicts the number of daily new cases.
There are changing predictions in the model over time. This is because there is a continuous slow drift in the parameter values of the current phase for India. This is causing a slow change in predictions and making it difficult to guess the right values.
All the data used for modeling is from www.covid19india.org, according to the researchers. The model can forecast well as long as the phase does not change. It is, however, a drawback of every model: it is hard to predict what will the future be when things are changing very fast on the ground. The model website helps in understanding the spread of Covid-19 in our country.
What about the third wave? What about future lockdowns?
Mathematical models help predict the intensity of coronavirus cases and influence policy decisions. The model predicts that the next wave of Covid cases would be in six to eight months from the second peak and its impact could be cushioned. It will be localized and many people might not get affected as they would have immunity due to vaccinations, according to Professor Agarwal.
This model can recommend good lockdown strategies. These strategies worked well in some states whereas were not useful in other states. The model can also suggest when to open lockdowns, depending upon the reach parameter value.