

Understanding lock down Effects on Cities with local transmissions of COVID-19
1. The Model
The model is completely based on Bayesian probability. It tries to simulate a real-world city with people, jobs, schools etc.
Here sub-models of the bigger models are:
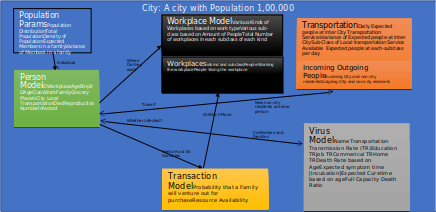
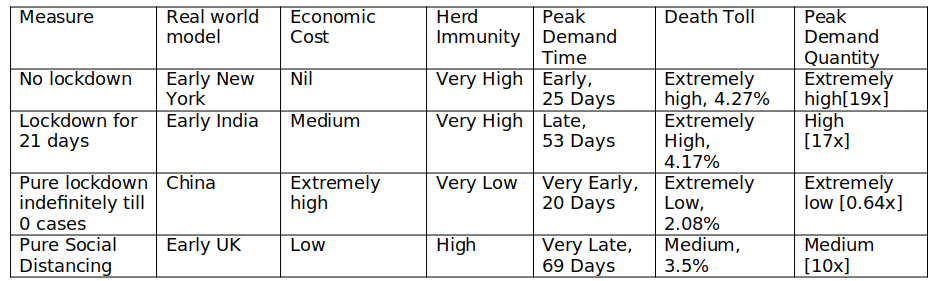
2. Assumptions
- As city is small all the Shops have expected 10-12 workers
- All Educational Institutions have expected 100 Students
- Every Office and Factory has expected 50 people.
- All details about virus death rates transmission rates is based on exposure time (for instance, you have a large amount of exposure when you are at home hence high chances of transmission compared to someone shopping) as per specified by WHO
- Rest of Virus model parameters such as death rates are based on existing database
- Hospital Workers are immune to disease [Wrong assumption but let’s assume govt is proactive in providing them immunity]
- Once contacted you can’t get the disease back, and once recovered you will be Quarantined for 28 days before resuming activities.
- First Case is always brought by a non-city resident (i.e imported)
- In ideal case, one doctor would be able to attend 1 patient in a perfect manner. If its >1 then the doctors are overburdened and death rates increases.
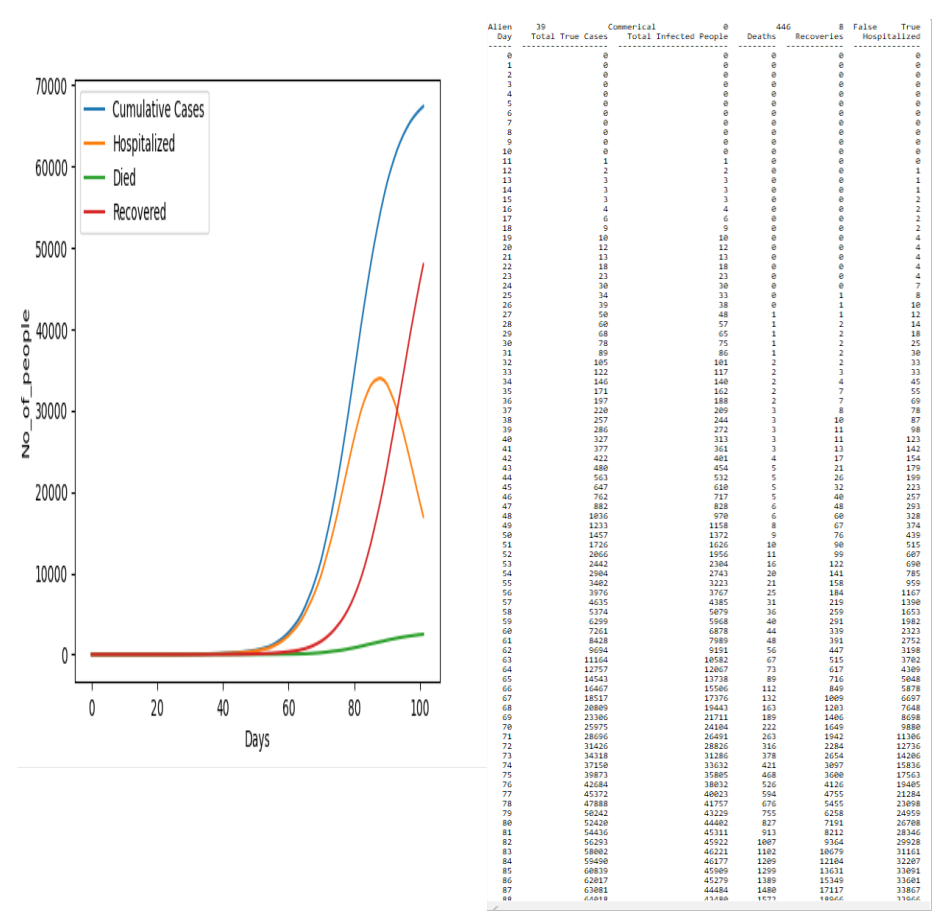
3. Results when no lock down is imposed
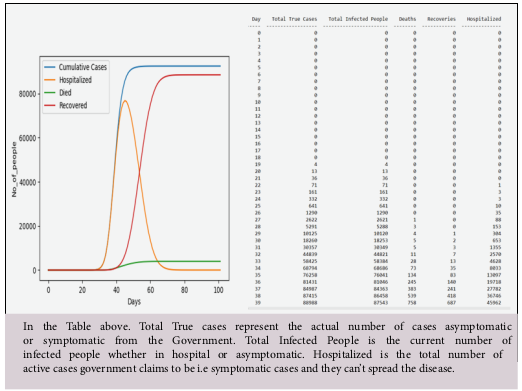
Results appear to be catastrophic if people resume their activities as they usually do. This can be understood to be what happened in New York. As this data suggests, with the first case detected only after the 19th day, if no lock down is imposed, the city would be completely devastated. The city would go from its 1st official case on Day 22 to 45,962 on Day 39 i.e within the span of 17 days. Worst part about the no lock down policy is that when the government realizes it
has 45000 odd cases.
The Final Result at Day 100:
- Cumulative Cases: 92524 (92.5% of population)
- Total Dead: 3952 (3.95% of population; 4.27% of total cases)
- Peak Hospitalization Number: 76846 (19.51 times the hospital capacity) on Day 45 [25 days after 10th True Case]
- Active cases < Deaths day: 65
- 10th True Case Day: Day 20
4. When Severe lock down for 21 days then normalcy
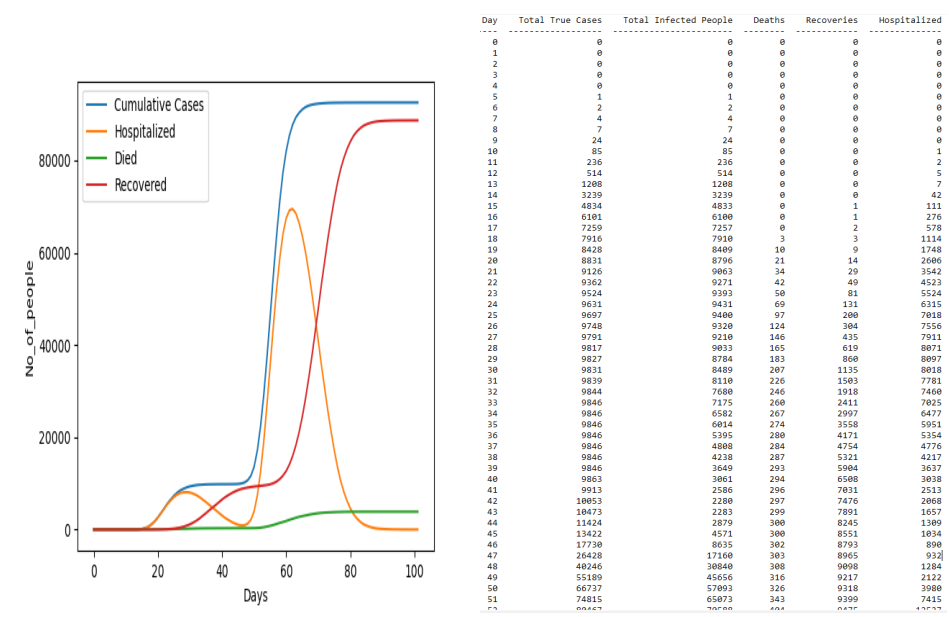
However good it seems, a 21 day lock down is essentially but not sufficient to eliminate the Disease. The Disease starts to flatten out but again peaks after a few days of Normal-Like environment. The government can easily be deceived that the Virus has been eliminated but that wouldn't actually be the case. In this scenario, first case appeared on Day 10 and subsequently increased manifold
peaking at 7500 on Day 26. In this simulation, the Schools and Colleges were closed on Day 14 [Cases: 42], Offices on Day 15 [Cases: 111], Social distancing measures on Day 17 [Cases: 276], And finally transportation services i.e complete lock down on Day 18 [Cases:1114]. After peaking till Day 30 at 8097 [12th Day of the lock down], the number of active cases decreased sharply to 3637 on Day 39 and further till 890 on Day 46. As visible from the table, number of true cases doesn't increase even by 1 for 7 straight days between 33rd to 39th indicating that the lock down as a measure is very effective [If
obeyed]. However, when lock down was lifted on Day 39 there were 12 Asymptomatic patients still remaining.
Without the lock down in effect, these 12 people were solely responsible for taking the cases from 890 at Day 46 to 69,496 at Day 62. Number of true cases increased manifold from 9846 on Day
39 to 74,815 at Day 51.
5. 40 day lock down case
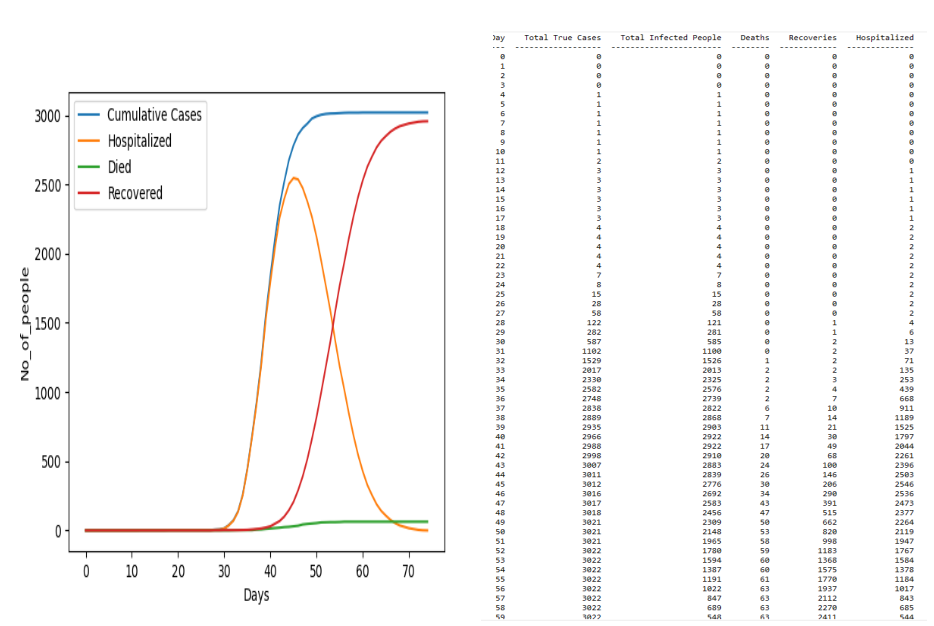
Severe lock down as in case of China, results in low peaks and is a very effective measure. Though the economic cost is very high, it could potentially be savior as number of active cases is 2500 at tops.
The first case appears on Day 11, and Education Lockdown on Day 31
[13 Cases], Office lock down Day 33 [135 cases], Social Distancing measures on Day 36 [668 Cases] and complete Lockdown on Day 38 [1189 cases]. The lock down decreases the rate of increase in true cases immediately and there is no increase in true cases since Day 52. By Day 74 there are no active cases. This results in less deaths
and less cases, but comes at a great economic cost.
Conclusion
Life-saver at a great economic cost. At least 40 days of Lockdown appears to be essential to completely eliminate Local Transmissions.
The Final Result at Day 100:
- Cumulative Cases: 3022 (3% of population) Total
- Dead: 63 (0.63% of population; 2.08% of
total cases) - Peak Hospitalization Number: 2546 (0.64
times the hospital capacity) on Day 45 [20
days after 10th True Case] - Active cases < Deaths day: 81
- lock down Day: Day 38
- 10th True Case Day: Day 25
6. Pure Social Distancing; Non-closure of Workplace
In this simulation, only pure social distancing has been implemented
without closing down commercial places and other places of work. The only lock down as a preventive measure is the transportation services being shut after 1000 cases. This model was implemented in the UK (Note that the UK withdrew it later).
However, this approach would have a lesser economic cost than a lock down. Social Distancing measures seem very effective at start, but they eventually would lead to a rise in a large number of cases. However, Social distancing flattens the curve a lot.
With a delayed peak and less peak hospitalization demand, more lives could be saved. If a lot of lives are saved, herd immunity develops and it helps in future outbreaks. This measure seems good but at the cost of
lives. Here social distancing was implemented from day 0. The 10th case was detected on Day 26. The number of hospitalized seems to peak at Day 88 which is far more days to prepare for. Note that this simulation doesn’t take into account that the government would be
better prepared at Day 88, and treats the level of preparedness same as Day 0. So, true deaths might be a lot lesser. The curve is severely
flattened in this case which is a good sign. The borders in this simulation were closed on Day 56 when the cases rose to 1167.
Conclusion
Social distancing ensures herd immunity. By Day 100, 47,942 people are immune to the disease and there is less economic impact as the workplace remains open. However, the drawback remains that a large number of lives would be lost.
The Final Result at Day 100:
- Cumulative Cases: 68912 (68.91 % of population)
- Total Dead: 2479 (2.479 % of population; 3.5% of total cases)
- Peak Hospitalization Number: 33966(10 times the hospital capacity) on Day 88 [69 days after 10th True Case]
- Active cases < Deaths day: Is somewhere greater than 100
- Borders Closed day: 56
- 10thTrue Case Day: Day 19
7. Final Conclusion
So overall, this model suggests various policies that government can adopt at city level. Though figures might not represent the exact real-world scenario because they are dependent on various parameters mentioned in [1]. Tweaking few parameters might lead to different scenario. Also note that, each of this simulation is based on a random city generated before the simulations began, so exact numbers may not represent the scene, however I tried to keep them as close as possible.
Solutions for India
In continuation to previous article, I present some solutions for Covid-19 specific to India. We already know our Hon’ble Prime Minister has declared lock down for 21 days and has extended it for further 20 Days. In my last article I clearly highlighted why 21 days lock down may not be enough, and suggested a 40-day lock down which seems to be the case. In these set of simulations, I present the rationale behind India’s strategy. Major difference in contrast to previous simulation is every simulation is run 4 times in parallel to avoid outliers and increase sample space. Also, the lock down dates have been defined exactly how Government of India did [1]:
- When Cases > 110: Complete education system locked [15thMarch in Real Dates]
- Cases>137: Social Distancing Implemented of degree 2[17th March].
- Cases>468: Transportation services barred [23rd March]
- Cases>519: Complete lock down [24th March]
A success criterion is defined when total cases increase<10000 post lock down with no rate of increase at the end.
Important definitions
- Social Distancing of degree x: represents that the transmission rates have fallen by ratio of 1/x. So, if transmission rate is 0.2, social distancing of degree 2 will mean 0.2/2=0.1 which would be our new transmission rate
- Mean: Average; Std Dev: How much reliable is our data (lesser the better); Median: Middle value
- 10th True Case Day: Day when total true cases reach 10
- Peak Hospitalization Number: Max number of patients admitted at a particular time
- Peak Hospitalization Day: Number of days required to reach peak hospitalization Number post 10th True case day
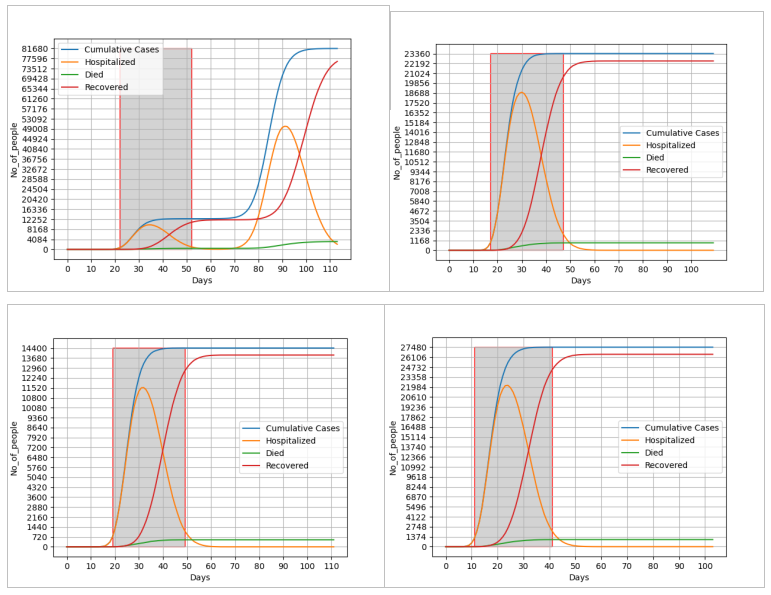
1. Why 21-Day Lockdown Might be A Failure
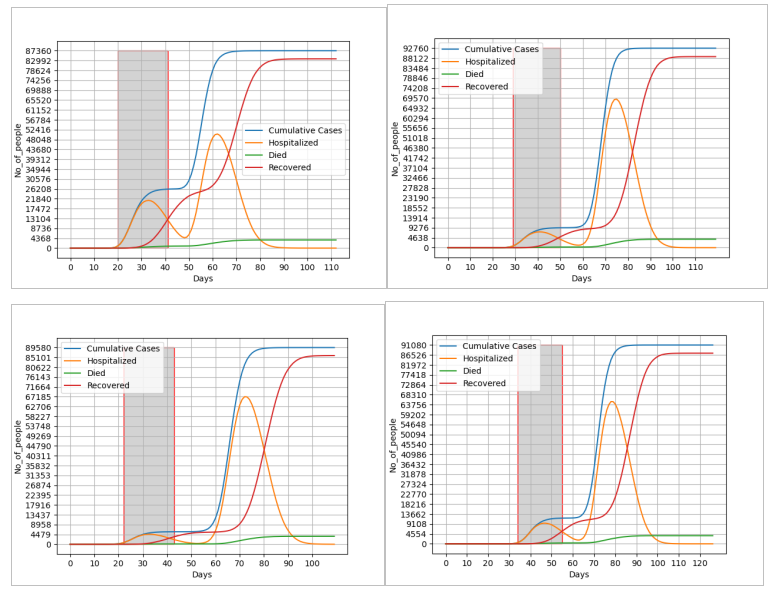
Conclusion
The number of cases remain low if the lock down is implemented early enough, but rise exponentially after the lock down is lifted. Just a 21 day lock down is not enough to significantly lower the number of cases.
Statistics for Day 100 Post 10th True case day
- Average Total Cases: 90205 [1989.9 Std Dev]
- Median Total Cases: 90339
- Average Deaths: 3725 [131.15 Std Dev] (4.12% of the average total Cases)
- Median Deaths: 3684
- Mean Peak Hospitalization Number: 62990 [Std Dev of 7341.02]
- Peak Hospitalization Day: 72th Day [Std Dev of 6.01]
- Success: 0
- Failures: 4
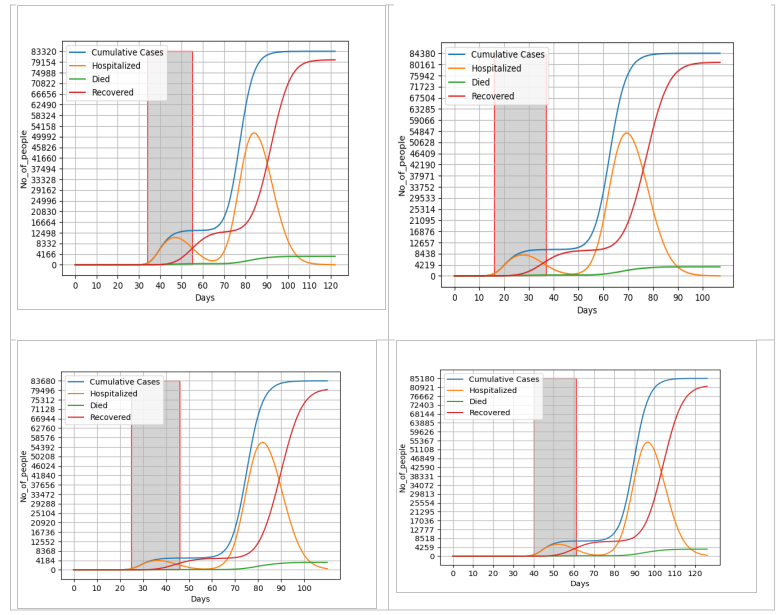
2. Why 40-Days Lockdown
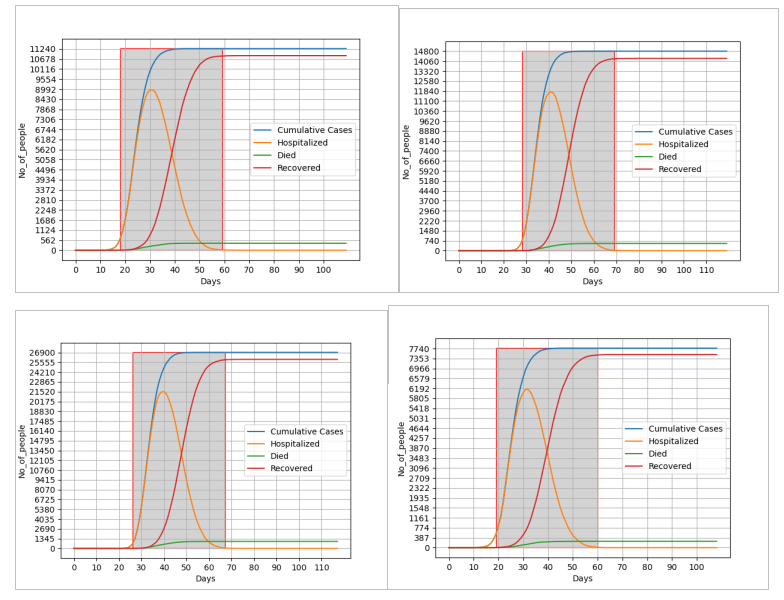
Conclusion
A 40 day lockdown, with all services and institutions opened after 40 days of lockdown, reduces the total number of cases significantly across all simulations. The peak number of hospitalizations is also significantly lower, which would prevent the health services from getting overloaded as they are in other countries right now. Only a few cases appear in the last few days of the lockdown and most importantly, the number of new cases continues to fall even after the lockdown is lifted.
Statistics for Day 100 Post 10th True case day
- Average Total Cases: 15,183 [7218.1 Std Dev]
- Median Total Cases: 13030
- Average Deaths: 534 [265.66 Std Dev] (3.51% of the average total Cases)
- Median Deaths: 463.5
- Mean Peak Hospitalization Number: 12102 [5785.77 Std Dev]
- Success: 4
- Failures: 0
- Peak Hospitalization Day: 36th Day [4.76 Std Deviation]
3. Why not 30-Days
Since the number of cases leading up to the lifting of the lockdown was very less, we might be tempted to lift the lockdown a little earlier. While this was effective in 7 out of 8 simulations, in the last one the effect was catastrophic, with 81.6% of the population infected.
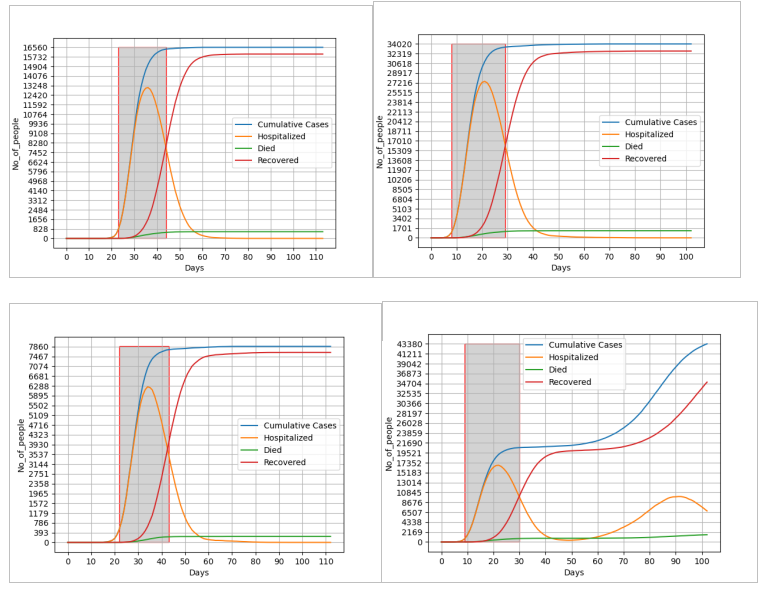
4. What If Social Distancing was implemented after a 21 day lock down
Conclusion
All 4 Times 80000+ Cases were reached, indicating that Lockdown with normal social distancing is not enough. With statistics mentioned below with 84197 average cases almost 85% people are affected indicating the measure is a failure. Average deaths linger around 3.98% at 3347 indicating lives are lost. However, with 68 days preparation time for Peak hospitalization, it is reasonable to say 21 days lockdowns does help the government to prepare better. With low standard deviation graphs can be considered quite accurate. The peak asymptomatic carriers of 23971 indicates government data cannot be considered reliable in such cases
Statistics for 100 days past 10th True case
- Average Total Cases: 84,197 [820 Std Dev]
- Median Total Cases: 84436
- Average Deaths: 3347 [55.8 Std Dev] (3.98% of the average total Cases)
- Median Deaths: 3355
- Mean Peak Hospitalization Number: 54114 [Std Dev of 1922.9]
- Success: 0
- Failures: 4
- Peak Hospitalization Day: 68th Day [5.2 Std Deviation]
- Peak Asymptomatic cases post 21 days Lockdown: 23971
5. Only Educational Places Shut Down And no Imported cases [Borders are closed]
Conclusion
The results are more mixed for this case. While the virus is contained to some extent in some cases, in others it spreads to more than 40% of the population.
Statistics for 100 days past 10th True case
- Average Total Cases: 25,591 [14303.49 Std Dev]
- Median Total Cases: 25,293
- Average Deaths: 921 [518.5 Std Dev] (3.58% of the average total Cases)
- Median Deaths: 915
- Mean Peak Hospitalization Number: 15925 [7635.59 Std Dev]
- Success: 2
- Peak Hospitalization Day: 26th Day [5.95 Std Deviation]
- Failures: 2
6. What if imported cases were Allowed?
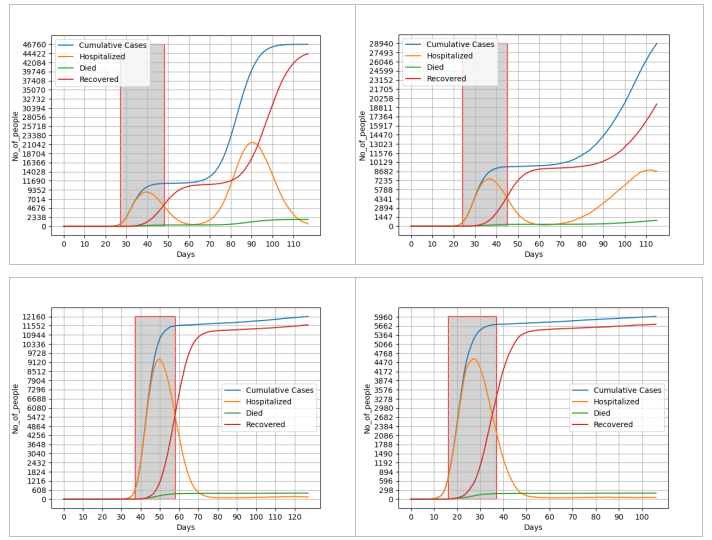
Opening the borders after the 21 day lockdown may lead a high number of cases after a temporary stop in the spread of the virus. Hence it is important that the borders be kept closed even after the end of the 21 day lockdown.
If anyone has any doubt, you can reach out to me at gauravs1729@gmail.com. Though I tried the explanation as simple as possible, the model is weirdly complex and based on large number of sampling and randomisation and consists of Bayesian probability. I hope this work helps in beating COVID-19.
Thanks,
Gaurav Suryawanshi,
4th Year Undergraduate,
Department of Mathematics,
IIT Kharagpur