
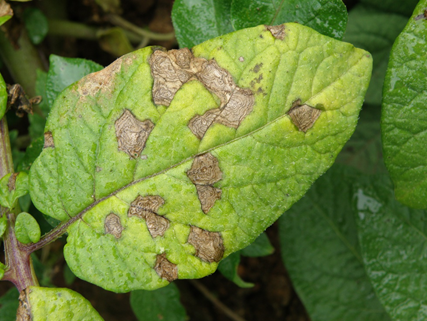
The world’s largest famine which occurred in Ireland during the mid-19th century also called great hunger that killed over a million people in Ireland, and the reason was Potato blight. Although now, globalization, advanced food storage, and preservation methods have probably thwarted the chances of such an enormous calamity, but potato blight continues to destroy vast amounts of crops, resources, and money. Blight is a common foliage disease in potato crops, which in the initial stages causes uneven light green lesions near the tip and the margins of the leaf but later aggravates to large brown to purplish-black necrotic patches and may end up wrecking the entire field if left undetected.
Figuring out the root of the problem and its implications
Joe Johnson, a research scholar at IIT Mandi, who is the lead author of this research, talks about the genesis of the study, “Government of India in recent times has been emphasizing on technology-driven betterment of crop production process. So, the Department of Biotechnology India, Centre for potato research India, and IIT Mandi decided to collaborate and resolve the issues in the farming of potatoes, which is one of the most predominant crops of Himachal Pradesh. The broad leaves of potato make it a good crop to start with for this type of detection techniques.”
Blight in its early stage is very difficult to judge for an untrained expert. However, it can be identified by a naked eye in its later stages. Still, its outbreaks spread quickly under favorable conditions (cool, wet weather) because the pathogen can produce vast numbers of wind-dispersed spores. “A farmer with years of experience or some trained personnel of a research institute can identify blight, but if someone gets a bit late in this detection, then often large fields are ruined by this disease. As we could arrange a large amount of data for our analysis, so we thought to build a data-driven deep learning model to ease out this process of detection. Smartphone has now turned into a basic amenity so if it would be possible for farmers just to click a pic and segregate the affected and unaffected crops, then won’t it be wonderful?”, says Joe.
Talking about more profound impacts of this problem, Joe says, “Fertilizers and pesticides account for a major cost in the cultivation of crops. The misjudgment of the disease often results in their unnecessary usage, which further causes depletion in soil fertility and harm the crops. It also is wastage of financial resources of the farmers.”
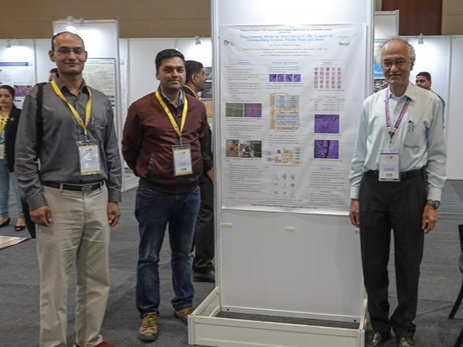
The Team that made it possible
“Coming together is a beginning. Keeping together is progress. Working together is success.” ~ Henry Ford
The research was led by Dr. Srikant Srinivasan, Associate Professor, School of Computing and Electrical Engineering, IIT Mandi. The results of the study have been recently published in the journal Plant Phenomics. Dr. Srikant Srinivasan and Dr. Shyam K. Masakapalli co-authored the paper along with research scholars Mr. Joe Johnson and Ms. Geetanjali Sharma, from IIT Mandi, and Dr. Vijay Kumar Dua, Dr. Sanjeev Sharma, and Dr. Jagdev Sharma, from Central Potato Research Institute, Shimla. “We were also assisted by a great team of around six field officers of CPRI in various northern cities like Mandi, Jalandhar, etc. Our project engineer Gurpreet helped us sort the data. Moreover, various members of project staff IIT mandi helped us in our data collection.”
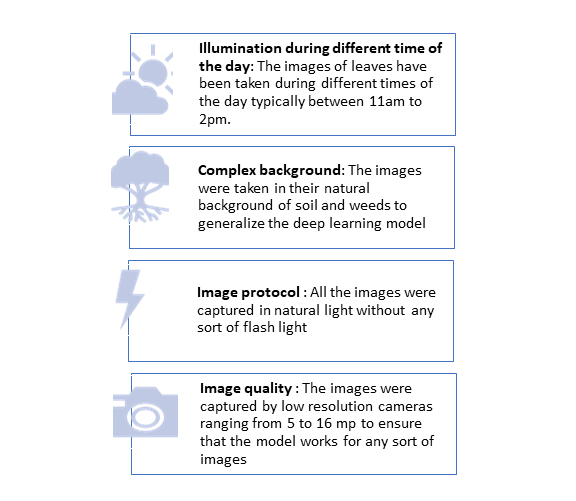
Well planned data collection to ensure a reliable model
“Prior to the development of such detection techniques, the leaves were laid on a white sheet to be detected in labs. But for a farmer, it is not feasible to provide a plane background to leaves while checking whether they are affected or not. So, we needed a model that could differentiate between soil patches and blight spots, a model that could work under different light illumination and backgrounds”, elaborates Joe on why they had a graphic data collection. Here is what makes their data collection diverse:
A multicolored vision of potato leaves
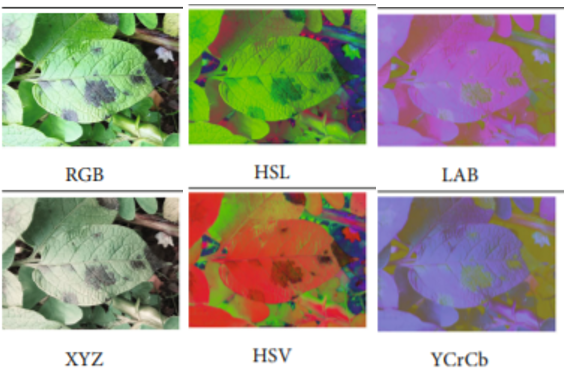
Discussing why and how they used different color spaces, Joe says, “Most developed countries use multispectral sensors to identify crop diseases. In general, a healthy leaf reflects colors appropriately and has a workable RGB spectrum, but a diseased leaf doesn’t give a great response to light. All the images were initially captured in RGB by normal mobile digital cameras of resolution varying from 5 to 16 megapixels. They were converted to five color spaces (HSV, HSL, XYZ, LAB, and YCrCb).” This algorithmic approach to process RGB images to different color spaces is far more cost-effective than the use of multispectral or hyperspectral cameras. The use of various color space transformations for pre-processing the data adds to the accuracy of results that have been evaluated for a very vivid data set. Further, each color space has different assets to offer; for instance, the XYZ color space has a wide distribution of intensity values for all the components, and the hue component of HSL and HSV is independent of the light illumination.
The Mask R-CNN-Based Model and its result analytics
Fast R-CNN is an image segmentation technique used for object detection tasks and returns the class label and bounding box coordinates for each object in the image. Mask R-CNN is an extension of Faster R-CNN, which will return the object mask in addition to the class label and bounding box coordinates for each object.
Joe explains upon the need of Mask R-CNN, “Visualizing the blocks of different types of regions as predicted by R-CNN models, that is blight, infected or healthy leaves is difficult. The additional masking feature of Mask-R-CNN produces a binary output for differently predicted regions, making it easy for us to segregate different regions.” Each color space dataset is used for training a separate Mask R-CNN detection model.
In computer vision, standard metrics like precision and recall are used to evaluate binary classification performance. The four components of the confusion matrix that is true positive (TP), true negative (TN), false positive (FP), and false-negative (FN), summarizes the performance of a classifier for a given test dataset. Other vital parameters in result analytics are intersection over union (IoU), average precision (AP), predicted instance (PI). These analytics evaluated the performance of two types of Mask R-CNN models for each color space:
- TWO CLASS MODEL: It demarcated two classes, potato blight patches and remaining as background. It also misclassified some soil patches to be blight patches.
- FOUR CLASS MODEL: In this model, Mask R-CNN model was trained to detect four classes: blight disease patches, infected leaves, healthy leaves, and the background. This model curtails misclassification to a large extent, and analytics also manifest that this model is better.
Implementation for on-ground use
"If the farmer is rich, then so is the nation." -Amit Kalantri
“A simple classification model can easily be incorporated into an application, but to incorporate our final model, which is highly accurate in a restricted memory space, is difficult.” The team is trying to scale down the memory requirements of the model and is also thinking of other options so that it becomes accessible to most farmers. Detailing about options the team is pondering upon, he says, “We are also thinking upon an online model. We may host our model on a server, and images clicked by farmers can be transferred to the server through the internet, and then the result of detection can be communicated back to farmers again.”
The agricultural industry has been the heart of our nation for ages. Such incredible research upon technological assistance in this domain will boost the functioning of this heart and ensure that no issues can curb it to pump out progress to the entire nation.
References: The paper published in plant phenomics https://downloads.spj.sciencemag.org/plantphenomics/2021/9835724.pdf