
Astronomy and science, in general, are entering a new era of discovery, coincident with establishing new facilities for observation and simulation that will routinely generate petabytes of data. Efficient data visualizing techniques will be required to predict patterns and see the underlying structure of the data. So, developing such tools has enormous applications and plays a critical role in scientific research.
Let’s first know more about the ISRO’s space observatory, AstroSat.
ASTROSAT
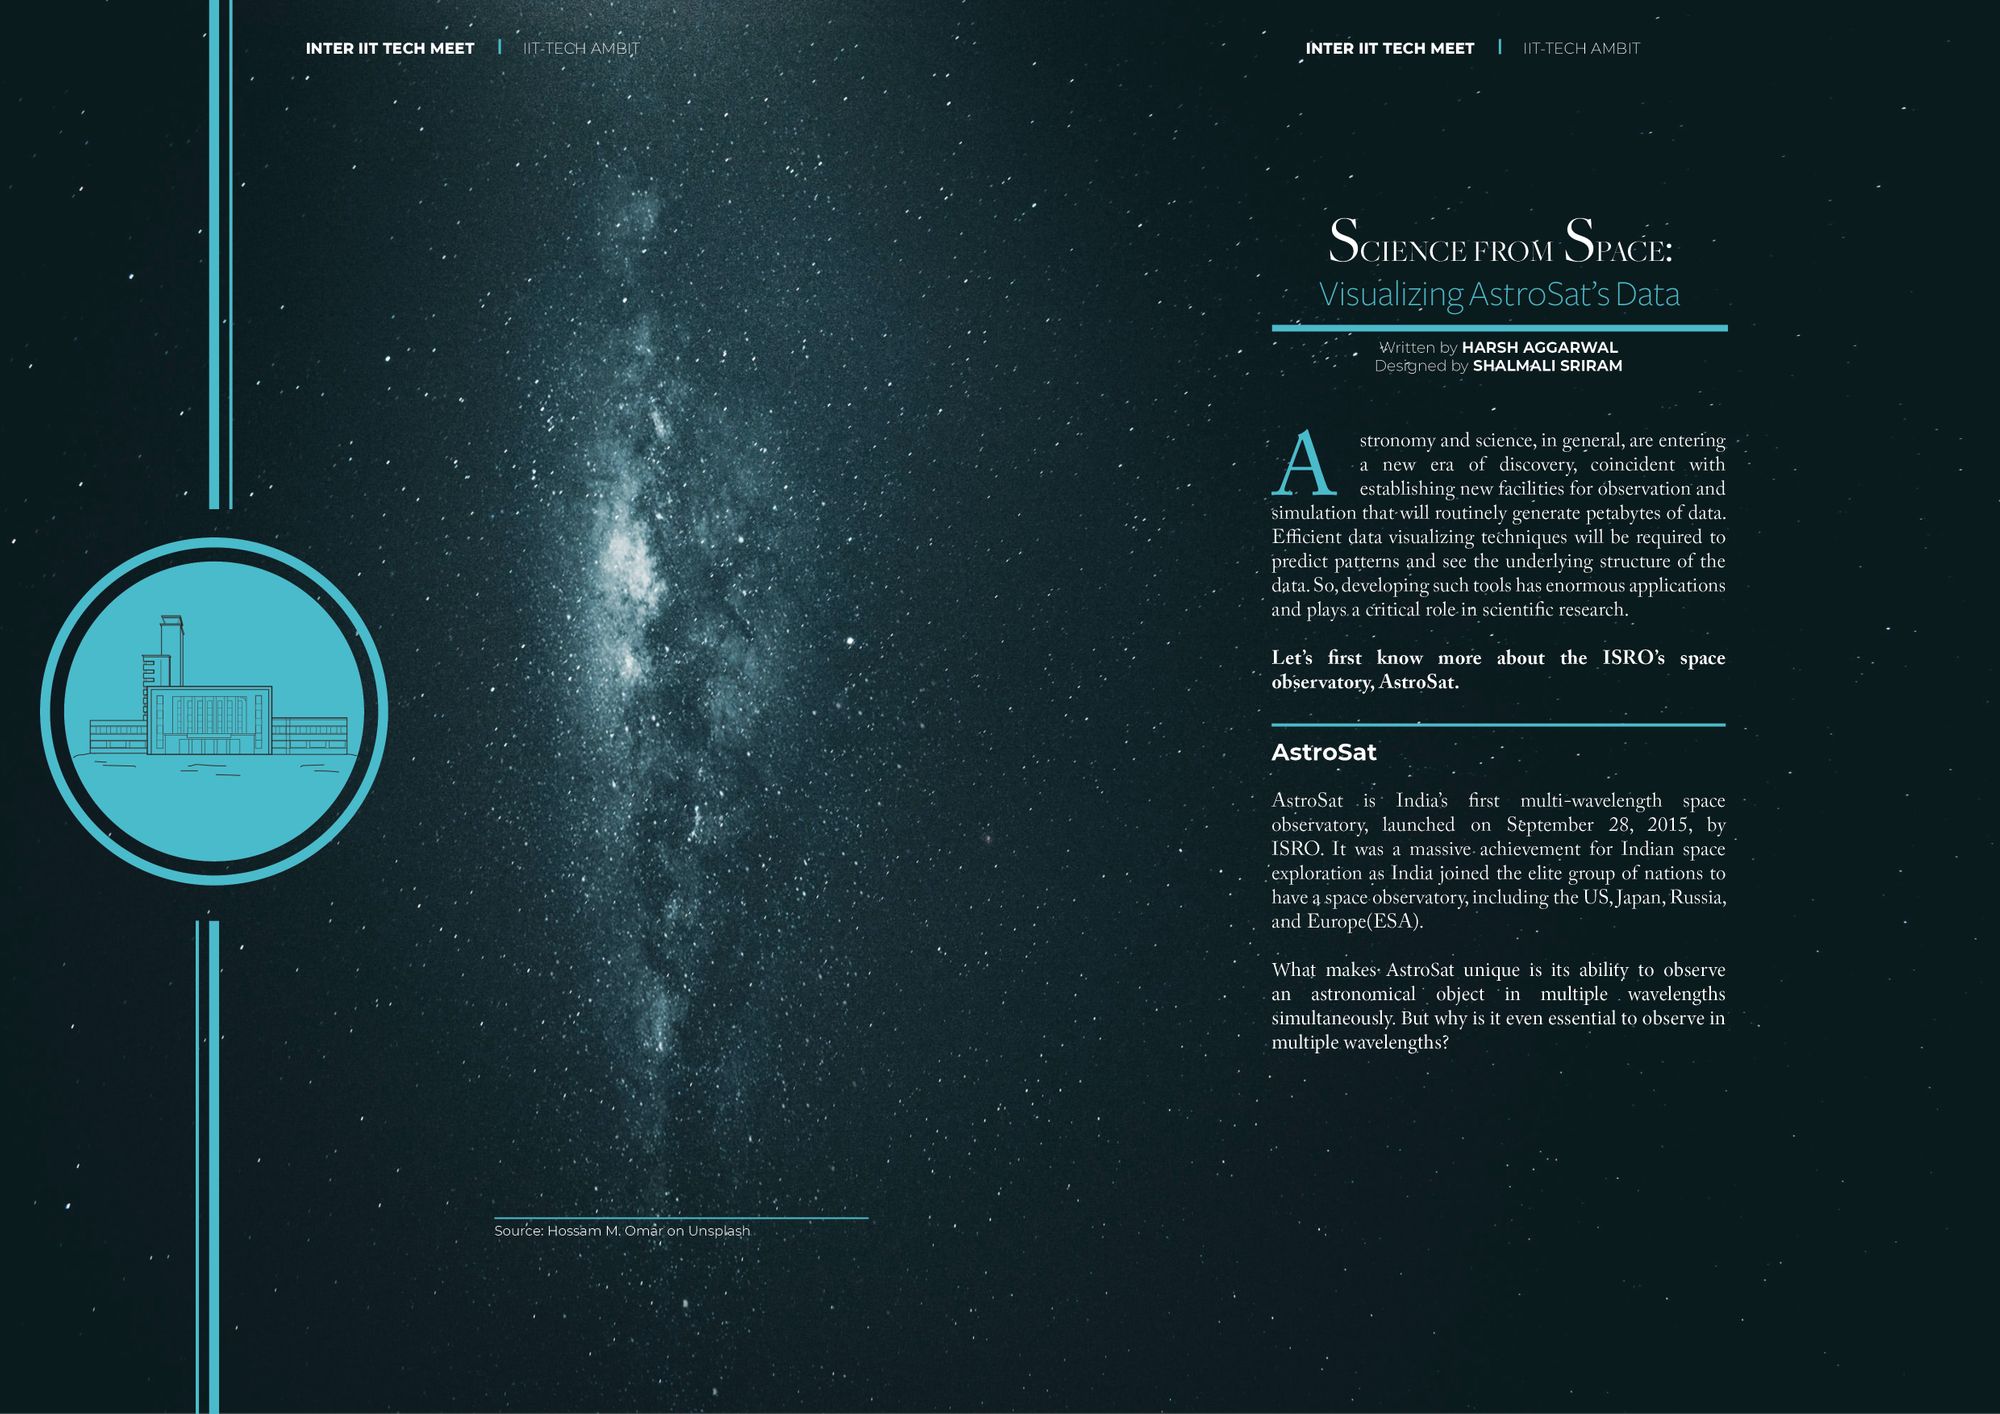
AstroSat is India’s first multi-wavelength space observatory, launched on September 28, 2015, by ISRO. It was a massive achievement for Indian space exploration as India joined the elite group of nations to have a space observatory, including the US, Japan, Russia, and Europe(ESA).

What makes AstroSat unique is its ability to observe an astronomical object in multiple wavelengths simultaneously. But why is it even essential to observe in multiple wavelengths?
Multiwavelength Astronomy
We are literally blind to much of what surrounds us as we can only see a very thin band in the vast range of lights emitted by the universe. Thus observing the universe in all wavelengths can give us a much deeper understanding of its inner workings, and Multiwavelength Astronomy exactly does that. A cosmic source is observed in multiple wavelengths, due to which new details are discovered that otherwise are invisible to human eyes.
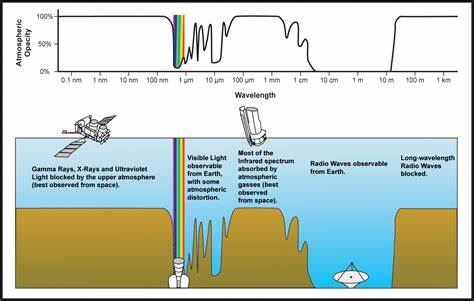
But there is a catch, our atmosphere absorbs most of the low-wavelength light rays. Therefore, observations in those wavelengths are taken from space using satellites like AstroSat, Hubble Space Telescope, etc.
AstroSat is in orbit 650 km above Earth’s surface and has a minimum useful life of 5 years. Being a multiwavelength satellite, it observes the universe in the Optical, Ultraviolet, low, and high energy X-ray regions of the electromagnetic spectrum. It has a total of five payloads( telescopes and scientific instruments), and each observes in a specific wavelength range. This mission’s primary scientific aim is to study high-energy processes in binary star systems, estimate the magnetic field of neutron stars, detect bright X-ray sources, and study the universe in the ultraviolet region.
So far, it has explored stars, star clusters, energetic phenomenons such as ultraviolet bursts, and many more astronomical objects. Recently, observations from AstroSat led to the discovery of a galaxy located 10 billion light-years away from Earth.
Web based Visualization tool for Astrosat observations
This was a Mid-preparation event by ISRO in the Inter IIT tech meet 2021, and the maximum points were 250.The problem statement for the event was -
Problem Statement
Students were provided with a catalog of AstroSat’s observations and were asked to develop a visualization tool for the data. There were several basic requirements from the tool.
It should generate a map of cosmic sources given in the catalog. When a source is selected, it should provide basic astronomical details and generate a list of publications related to the source. It should also be able to determine whether AstroSat observes the source or not. And most importantly, it should be portable to any other catalog with minimal modifications required.
Need of Visualization Tools in Astronomy
In a data-intensive science like Astronomy, such tools play a crucial role in understanding various astrophysical phenomena and generating maps of galaxies, star systems, and the universe. Aspects of visualization are utilized in multiple stages of astronomical research — from the planning through observing and running a simulation. Indeed, much of astronomy deals with the process of making and displaying two-dimensional (2D) images, graphs that are suitable for publication in books, journals, conference presentations, and in education.

The use of diagrams, maps, and graphs has a long history in astronomy to explain concepts, aid understanding, present results, and engage the public. However, data visualization is not taken seriously by scientists and is seen as really just kind of icing on the cake. As a result, science is littered with poor data visuals that can mislead the readers. The scientific community needs to realize that there is more to visualization than just making pretty pictures. Data visualization is a fundamental, enabling technology for knowledge discovery and an important research field in its own right.
Thus, we can say that making a visualization tool for AstroSat’s data is not just about winning a competition, but it serves a much bigger purpose in the field of space exploration and scientific research.
The Solution
Amongst the strong competitors, a team from IIT Kharagpur managed to bag the first position in this event. The team consisted of ten students, namely — Ananya Mahato, Akshay Chordia, Meher Changlani, Shashi Ranjan, Himadri Saha, Shubham Mishra, Radhika Patwari, Snehal Reddy, Koukuntla Manjunath Bhat, Ayush Akarsh.
The team developed a web tool called NaxTara in the form of a celestial sphere with all the sources given in the catalog. Users can navigate through the space on the map with zoom in and zoom out features. Clicking on colored sources will generate a list containing information like Right Ascension and declination(Together, they give the location of a source in the sky), Magnitude(Measure of brightness), etc., and publications for that source. Apart from that, they differentiated the sources observed by AstroSat from other sources by using different colors. They also implemented a search bar feature to find a particular source.

Some of the ideas were taken from pre-existing open-source Astronomy visualization tools like Stellarium and Aldain Sky Atlas.
“It is interesting to note that that we added the search bar only 3 hours before the submission deadline,” informed a team member.
For the website, the Backend was written entirely in python, and the Frontend was written in Javascript with Three.js and Tween.js.
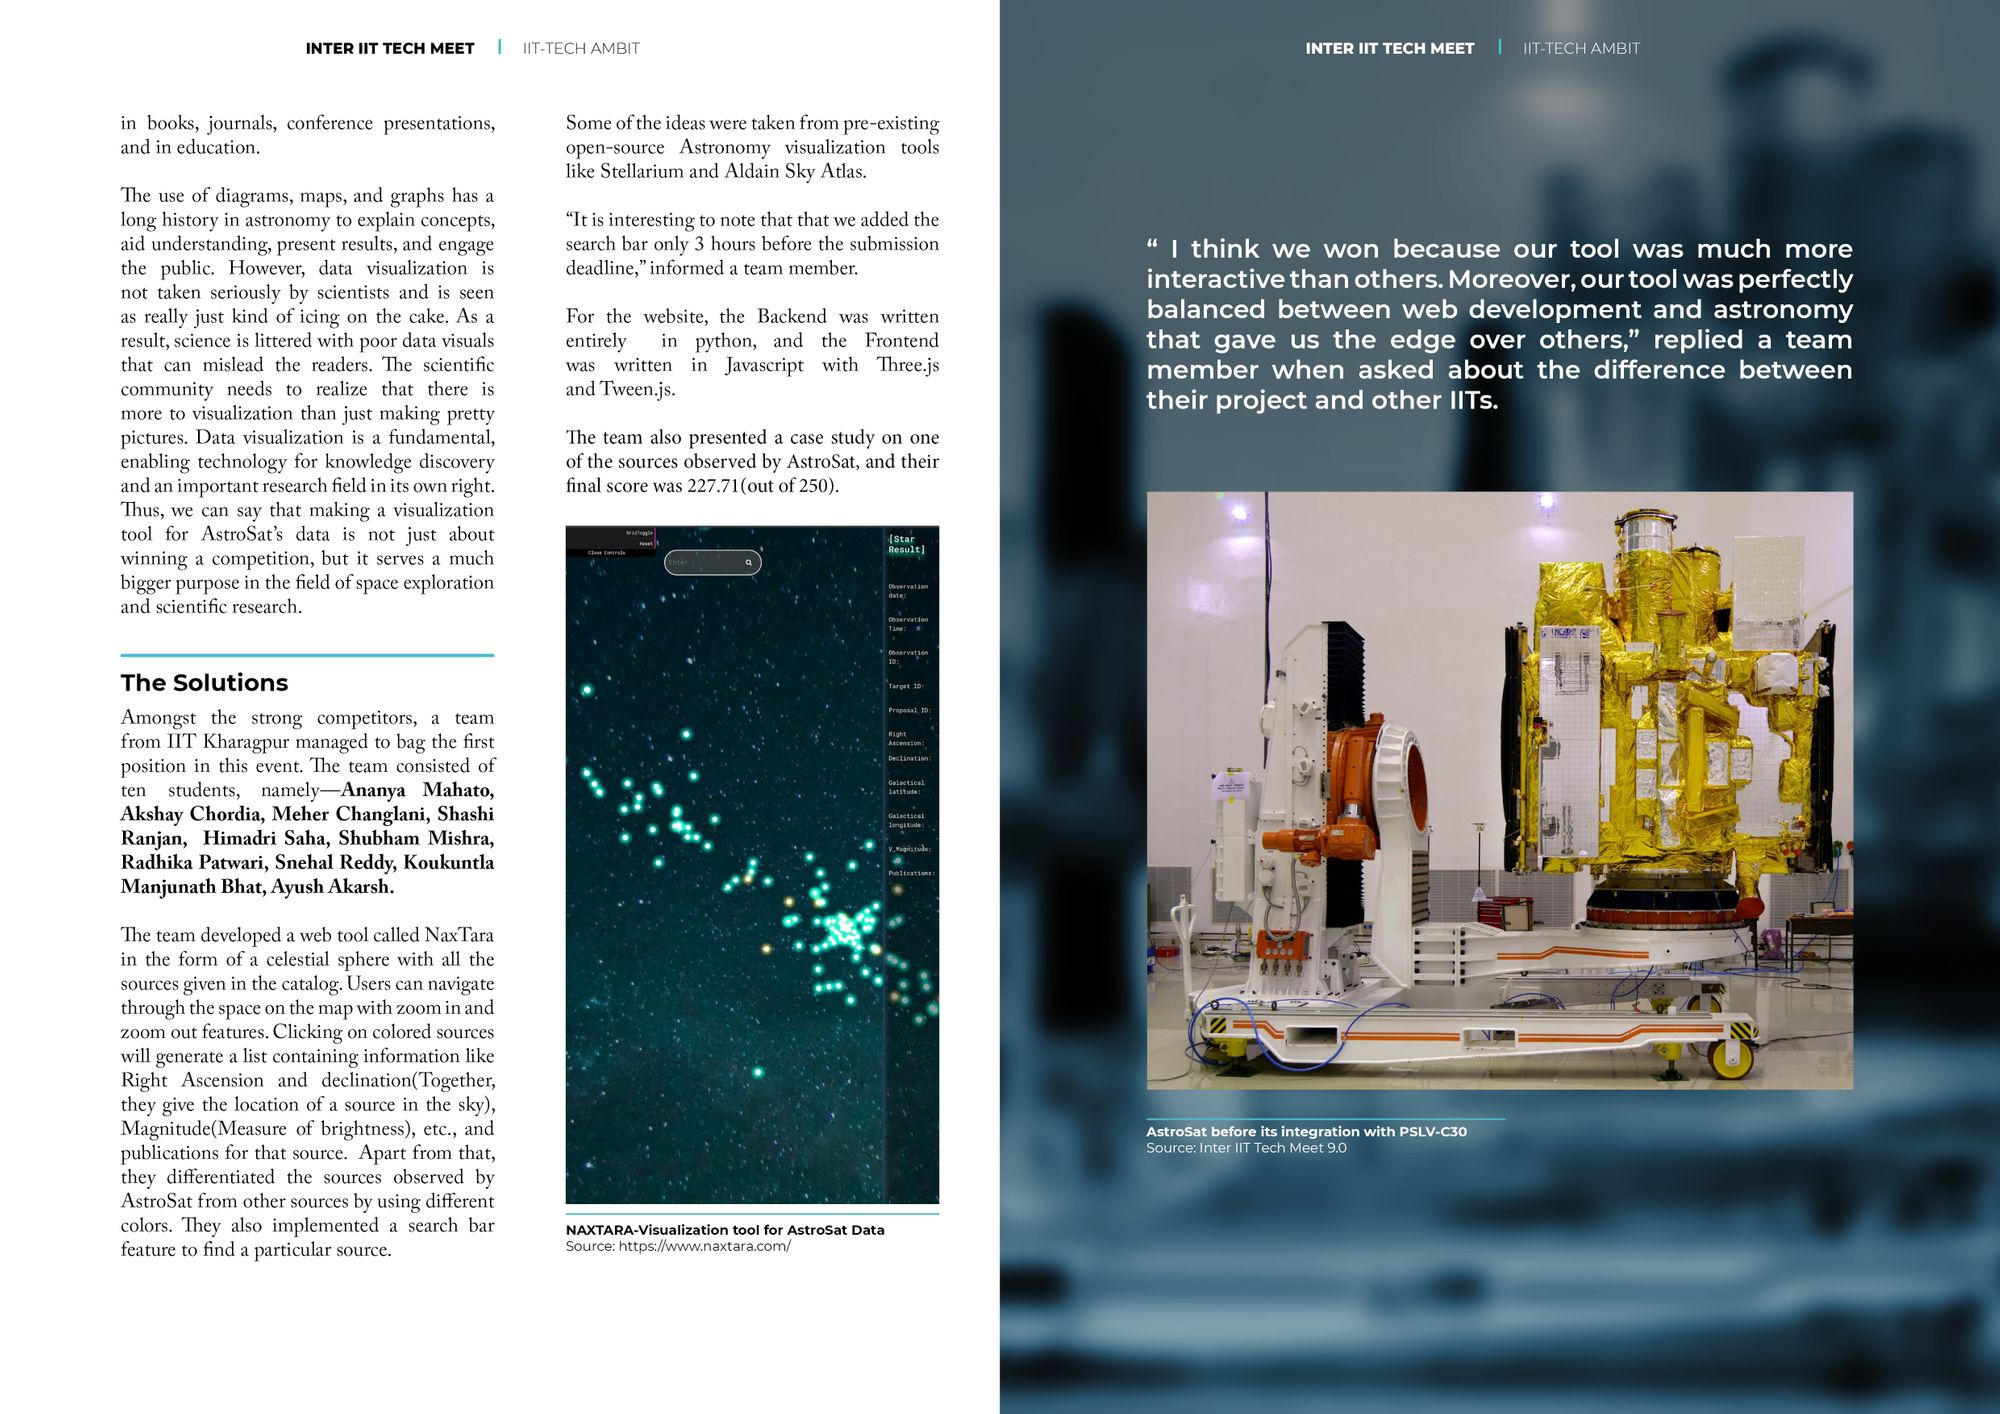
“ I think we won because our tool was much more interactive than others. Moreover, our tool was perfectly balanced between web development and astronomy that gave us the edge over others,” replied a team member when asked about the difference between their project and other IITs.
The team also presented a case study on one of the sources observed by AstroSat, and their final score was 227.71(out of 250).
Here is the link to their award-winning website: NaXTara
